Multiple Choice
Identify the
choice that best completes the statement or answers the question.
|
|
|
1.
|
Statistics/Probability and Graphing – Combinations & Permutations
– RIT191 – 200
In how many
different ways can the letters in the word MATH be
arranged?
|
|
|
2.
|
Statistics/Probability and Graphing – Graphing – RIT 191 –
200
 What
subtraction sentence is modeled on the number line shown above? What
subtraction sentence is modeled on the number line shown above?
a. | 3 + 6 =
9 | d. | 6 – 4 =
2 | b. | 6 – 2 =
4 | e. | 4 – 2 = 2 | c. | 2 + 6 = 8 |
|
|
|
3.
|
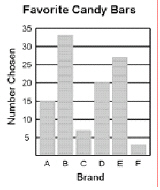 How many people choose brand E?
|
|
|
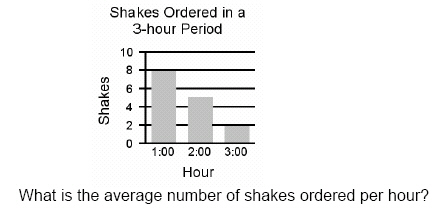
4.
|
Look at the graph. It
represents the number of milkshakes ordered at
“Shakeland” in a three hour
period.
|
|
|
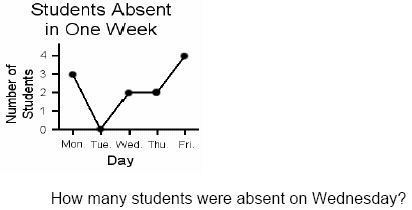
5.
|
The line graph shows the number
of students that were absent from a third
grade class in one week.
|
|
|
6.
|
a. | blue | d. | hazel | b. | brown | e. | other | c. | green |
|
|
|
7.
|
a. | Monday | d. | Thursday | b. | Tuesday | e. | Friday | c. | Wednesday |
|
|
|
8.
|
Statistics/Probability and
Graphing – Probability and Prediction – RIT 191 –200
Without looking, you pull out only one M&M from a bag
that contains 5 red, 10
green, 5 yellow, 5 orange, and 5 blue M&M’s. What color are you
most
likely to pull out?
a. | red | d. | orange | b. | green | e. | blue | c. | yellow |
|
|
|
9.
|
Statistics/Probability and Graphing – Statistics – RIT 191 –
200
In a survey of 30 seventh graders'
favorite colors, 5 chose red, 10 chose blue,
7 chose green, and 8 chose yellow. What is the
correct tally entry for green?
|
|
|
10.
|
Statistics-Probability-Graphing191-200
|
|
|
11.
|
a. | More than half of the students chose
math. | b. | The least number of students chose art. | c. | Half of the students chose
reading. | d. | The greatest number of students chose
science. | e. | Half of the students chose music.
|
|
|
|
12.
|
Statistics/Probability and
Graphing – Probability and Prediction – RIT 201 –210
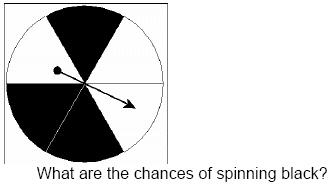
a. | one out of
six | d. | five out of
six | b. | three out of four | e. | three out of six | c. | one out of three |
|
|
|
13.
|
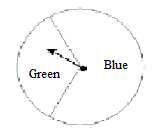 The spinner will: a. | usually land on
blue. | d. | always land on
green. | b. | always land on blue. | e. | never land on blue. | c. | usually land on
green. |
|
|
|
14.
|
a. | 4 out of
7 | d. | 0 out of
7 | b. | 3 out of
7 | e. | 10 out of 7 | c. | 7 out of 7 |
|
|
|
15.
|
Statistics/Probability and Graphing – Statistics – RIT 201 –
210
Sal sold 20 pizzas on Monday, 17 on Tuesday,
and 23 on Wednesday.
What is the average number of pizzas Sal sold?
|
|
|
16.
|
Statistics/Probability and Graphing – Graphing – RIT 211 –
220
|
|
|
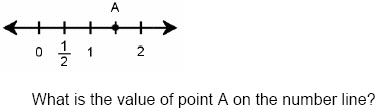
17.
|
a. | –4, 4, -1,
3 | d. | –4, -3, 1,
2 | b. | –1, -4, 3,
4 | e. | –4, -1, 2, 3 | c. | 4, 3, -1, -4 |
|