Multiple Choice
Identify the
choice that best completes the statement or answers the question.
|
|
|
1.
|
Statistics/Probability and Graphing – Graphing – RIT 171 –
180
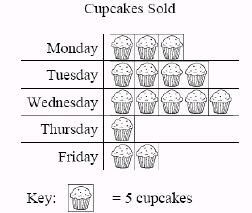 How many cupcakes were sold
on Wednesday? How many cupcakes were sold
on Wednesday?
|
|
|
2.
|
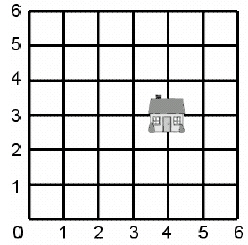 At what point is the house
on the grid? At what point is the house
on the grid?a. | (4,4) | d. | (3,2) | b. | (2,2) | e. | (3,4) | c. | (4,3) |
|
|
|
3.
|
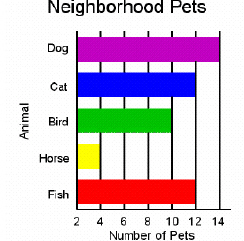 Which pet did the most children have? a. | Dog | d. | Horse | b. | Cat | e. | Fish | c. | Bird |
|
|
|
4.
|
Statistics/Probability and Graphing – Probability and Prediction –
RIT 171 –180
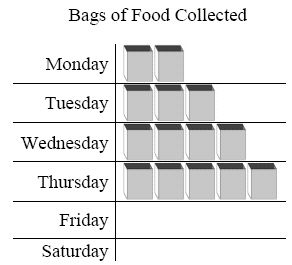 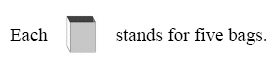 How many bags do you think will be collected on
Friday? How many bags do you think will be collected on
Friday?
|
|
|
5.
|
Joan is making a quilt. She
puts 4 stars in the first row, 5 stars in the second
row, and 4 stars in the third
row.
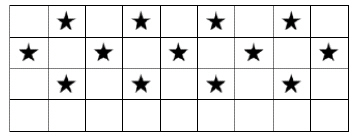 How many stars will Joan put in the fifth row? How many stars will Joan put in the fifth row?
|
|
|
6.
|
Statistics/Probability and Graphing – Graphing – RIT 181 –
190
Mrs. Smith’s class did a survey to see which was the
favorite color of
bicycles for third grade students. Read the graph below.
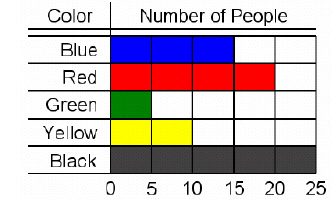 Which color was the favorite? Which color was the favorite?
a. | Red | d. | Blue | b. | Yellow | e. | Green | c. | Black |
|
|
|
7.
|
Statistics/Probability and Graphing – Probability – RIT 181 –
190
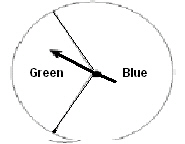
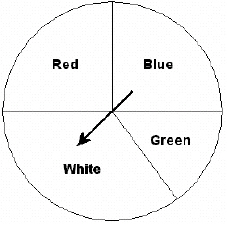 What is
the probability of the spinner stopping on yellow? What is
the probability of the spinner stopping on yellow?
a. | possible | d. | impossible | b. | likely | e. | unlikely | c. | certain |
|
|
|
8.
|
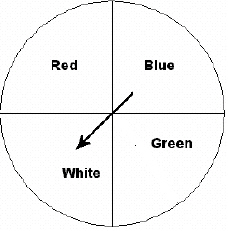 What is
the probability of the spinner stopping on blue? What is
the probability of the spinner stopping on blue?a. | 1 to 3 | d. | 3 to 4 | b. | 5 to 2 | e. | 3 to 1 | c. | 1 to 4 |
|
|
|
9.
|
Statistics/Probability and Graphing – Combinations & Permutations
– RIT 191 – 200
In how many different
ways can the letters in the word MATH be
arranged?
|
|
|
10.
|
Statistics/Probability and Graphing – Graphing – RIT 191 –
200
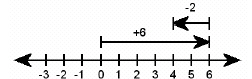 What
subtraction sentence is modeled on the number line shown above? What
subtraction sentence is modeled on the number line shown above?
a. | 3 + 6 =
9 | d. | 6 – 4 =
2 | b. | 6 – 2 =
4 | e. | 4 – 2 = 2 | c. | 2 + 6 = 8 |
|
|
|
11.
|
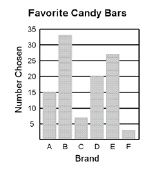 How many people chose brand E?
|
|
|
12.
|
Look at the graph. It
represents the number of milkshakes ordered at
“Shakeland” in a three hour
period.
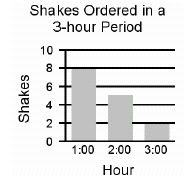 What is the average number of shakes ordered per
hour? What is the average number of shakes ordered per
hour?
|
|
|
13.
|
The line graph shows the number
of students that were absent from a third
grade class in one week.
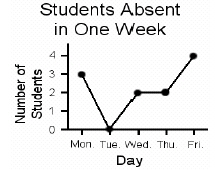 How many students were absent on Wednesday? How many students were absent on Wednesday?
|
|
|
14.
|
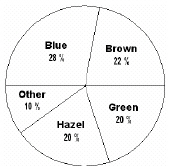
What is the most common
eye color?a. | blue | d. | hazel | b. | brown | e. | other | c. | green |
|
|
|
15.
|
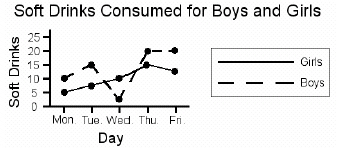 On which day did the boys
drink less soft drinks than the girls? On which day did the boys
drink less soft drinks than the girls? a. | Monday | d. | Thursday | b. | Tuesday | e. | Friday | c. | Wednesday |
|
|
|
16.
|
Statistics/Probability and Graphing – Probability and Prediction –
RIT 191 –200
Without looking, you pull out
only one M&M from a bag that contains 5 red, 10
green, 5 yellow, 5 orange, and 5 blue
M&M’s. What color are you most
likely to pull out?
a. | red | d. | orange | b. | green | e. | blue | c. | yellow |
|
|
|
17.
|
Statistics/Probability and Graphing – Statistics – RIT 191 –
200
In a survey of 30 seventh graders' favorite
colors, 5 chose red, 10 chose blue,
7 chose green, and 8 chose yellow. What is the correct tally
entry for green?
|
|
|
18.
|
Bill received the following
scores on 5 tests: 90, 90, 80, 70, 70. What was his
average test score?
|
|
|
19.
|
Statistics-Probability-Graphing191-200
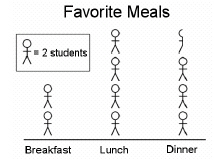
How
many students chose lunch as their favorite meal?
|
|
|
20.
|
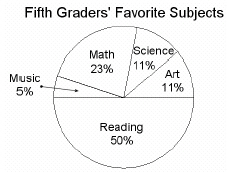 Which statement is true
about the graph? Which statement is true
about the graph?a. | More than half of the students chose
math. | b. | The least number of students chose art. | c. | Half of the students chose
reading. | d. | The greatest number of students chose
science. | e. | Half of the students chose music.
|
|
|
|
21.
|
Statistics/Probability and Graphing – Probability and Prediction –
RIT 201 –210
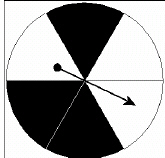 What are the chances of
spinning black? What are the chances of
spinning black?
a. | one out of
six | d. | five out of
six | b. | three out of four | e. | three out of six | c. | one out of three |
|
|
|
22.
|
 The spinner will: a. | usually land on
blue. | d. | always land on
green. | b. | always land on blue. | e. | never land on blue. | c. | usually land on
green. |
|
|
|
23.
|
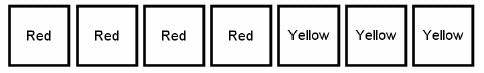
These squares are put in a
bag. How frequently will a red be pulled out of the bag?a. | 4 out of
7 | d. | 0 out of
7 | b. | 3 out of
7 | e. | 10 out of 7 | c. | 7 out of 7 |
|
|
|
24.
|
Statistics/Probability and Graphing – Statistics – RIT 201 –
210
Sal sold 20 pizzas on Monday, 17 on Tuesday, and
23 on Wednesday.
What is the average number of pizzas Sal sold?
|