Multiple Choice
Identify the choice that best completes the
statement or answers the question.
|
|
|
1.
|
Statistics/Probability and Graphing –
Graphing – RIT 221 – 230
The graph shows the number of people who went on
various rides during one hour at an amusement park. 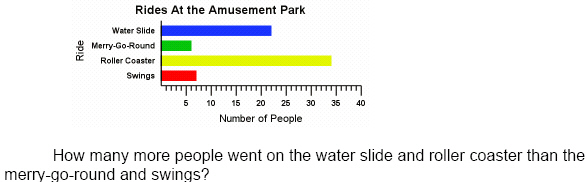
|
|
|
2.
|
a. | (2, -4) | d. | (-3, 4) | b. | (3, -4) | e. | (-4, -3) | c. | (-3,-4) |
|
|
|
3.
|
Statistics/Probability and Graphing –
Probability and Prediction – RIT 221 – 230
|
|
|
4.
|
Statistics/Probability and Graphing –
Statistics – RIT 221 – 230
Compute the mean, median, and mode for the
following set of data:
7, 6, 2, 2, 3, 2, 7, 3
a. | mean = 4; median = 2; mode = 3 | d. | mean = 4; median = 3; mode =
2 | b. | mean = 32; median = 3; mode = 2 | e. | mean = 32; median = 6; mode =
8 | c. | mean = 8; median = 6; mode = 7 |
|
|
|
5.
|
Statistics/Probability and Graphing –
Graphing – RIT 231 – 240
|
|
|
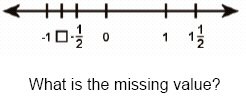
6.
|
|
|
|
7.
|
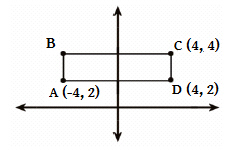 What are the coordinates of point B? a. | (-4,-4) | d. | (2,-4) | b. | (4,-4) | e. | (-2,4) | c. | (-4,4) |
|
|
|
8.
|
|
|
|
9.
|
Statistics/Probability and Graphing –
Statistics – RIT 231 – 240
Find the range, mean, median, and mode.
{6,
5, 10, 4, 5, 3, 2}
a. | Range = 10; Mean = 35; Median = 5; Mode = 5 | b. | Range = 10; Mean =
5; Median = 5; Mode = 10 | c. | Range = 8; Mean = 35; Median = 5; Mode =
10 | d. | Range = 10; Mean = 35; Median = 8; Mode = 10 | e. | Range = 8; Mean = 5;
Median = 5; Mode = 5 |
|