Multiple Choice
Identify the
choice that best completes the statement or answers the question.
|
|
|
1.
|
Problem Solving – RIT 221 – 230
1. 2, 9, 7, 14, 12, ___, ___
What are the missing
numbers?
a. | 8, 10 | d. | 3, 5 | b. | 5, 3 | e. | 17, 19 | c. | 5, 7 |
|
|
|
2.
|
Yuko’s pen pal in England
said her backyard was 50 meters wide. In
customary measurement that is about 150
_____.
a. | Feet | d. | Centimeters | b. | Yards | e. | Miles | c. | Inches |
|
|
|
3.
|
Use a proportion to
solve.
If four all weather tires cost $903.80, how much would 1 tire cost?
|
|
|
4.
|
Write an equation you would use
to solve the problem?
On a winter day it was –10F at 6:00 A.M. The temperature rose 25
during
the day. What was the high temperature?
|
|
|
5.
|
 Which
statement is true? Which
statement is true?
|
|
|
6.
|
Interest formula: I =
prt
Using the interest formula, how much interest is charged on a 30 year,
$100,000 house loan
at 6%?
a. | $6,000 | d. | $180,000 | b. | $27,000 | e. | $300,000 | c. | $30,000 |
|
|
|
7.
|
Estimate the solution to the
following problem.
The times for John’s 100m dash season are: 12.9, 13.2, 10.9, 13.5,
12.0,
and 11.8. What is a good estimate of John’s average time?
a. | 18.9 | d. | 10.0 | b. | 15.0 | e. | 11.1 | c. | 12.5 |
|
|
|
8.
|
A bag containing 100
M&M’s contains 23 red, 54 brown, 15 yellow, and 8
orange candies. What is the
probability of getting a yellow M&M
a. | 23
100 | d. | 46
100 | b. |
3
20 | e. | 17
20 | c. | 54
100 |
|
|
|
9.
|
Statistics/Probability and Graphing – Graphing – RIT 211 –
220
|
|
|
10.
|
a. | –4, 4, -1,
3 | d. | –4, -3, 1,
2 | b. | –1, -4, 3,
4 | e. | –4, -1, 2, 3 | c. | 4, 3, -1, -4 |
|
|
|
11.
|
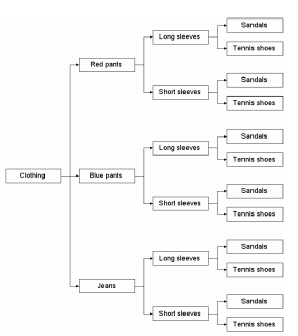 Kali
chooses her clothing using the tree diagram above. How many Kali
chooses her clothing using the tree diagram above. How many
possible choices for clothing does she
have?
|
|
|
12.
|
Statistics/Probability and
Graphing – Graphing – RIT 221 – 230
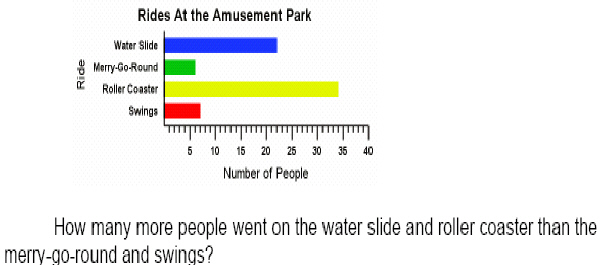
The graph shows the number of people who
went on various rides during
one hour at an amusement park.
|
|
|
13.
|
a. | (2, -4) | d. | (-3, 4) | b. | (3, -4) | e. | (-4, -3) | c. | (-3,-4) |
|
|
|
14.
|
Statistics/Probability
and Graphing – Probability and Prediction –
RIT 221 – 230
|
|
|
15.
|
Statistics/Probability and Graphing – Statistics – RIT 221 –
230
Compute the mean, median, and mode for the
following set of data:
7, 6, 2, 2, 3, 2, 7, 3
a. | mean = 4; median = 2; mode =
3 | d. | mean = 4; median = 3; mode =
2 | b. | mean = 32; median = 3; mode =
2 | e. | mean = 32; median = 6; mode =
8 | c. | mean = 8; median = 6; mode =
7 |
|